You know that feeling in the pit of your stomach? The one that hits when a critical application slows to a crawl, and the calls start flooding in from remote employees, clients, and your own leadership team. In today’s decentralized world, your network isn’t just in the office anymore. It’s in the cloud, at your employee’s house, and everywhere in between. And that feeling of uncertainty… it’s a symptom of a much bigger problem: a lack of unified visibility.
You’re not alone. With over 90% of organizations now running on hybrid or multi-cloud environments, the complexity has exploded. The old way of monitoring—siloed tools for on-prem servers and separate dashboards for cloud services—just doesn’t cut it. It leaves you reactive, constantly fighting fires instead of preventing them.
But what if you could change that?
What if you could adopt the same elite monitoring principles Google uses to run its global infrastructure, apply them to your unique hybrid setup, and then translate those technical insights into a clear, compelling report that makes perfect sense to your executive team?
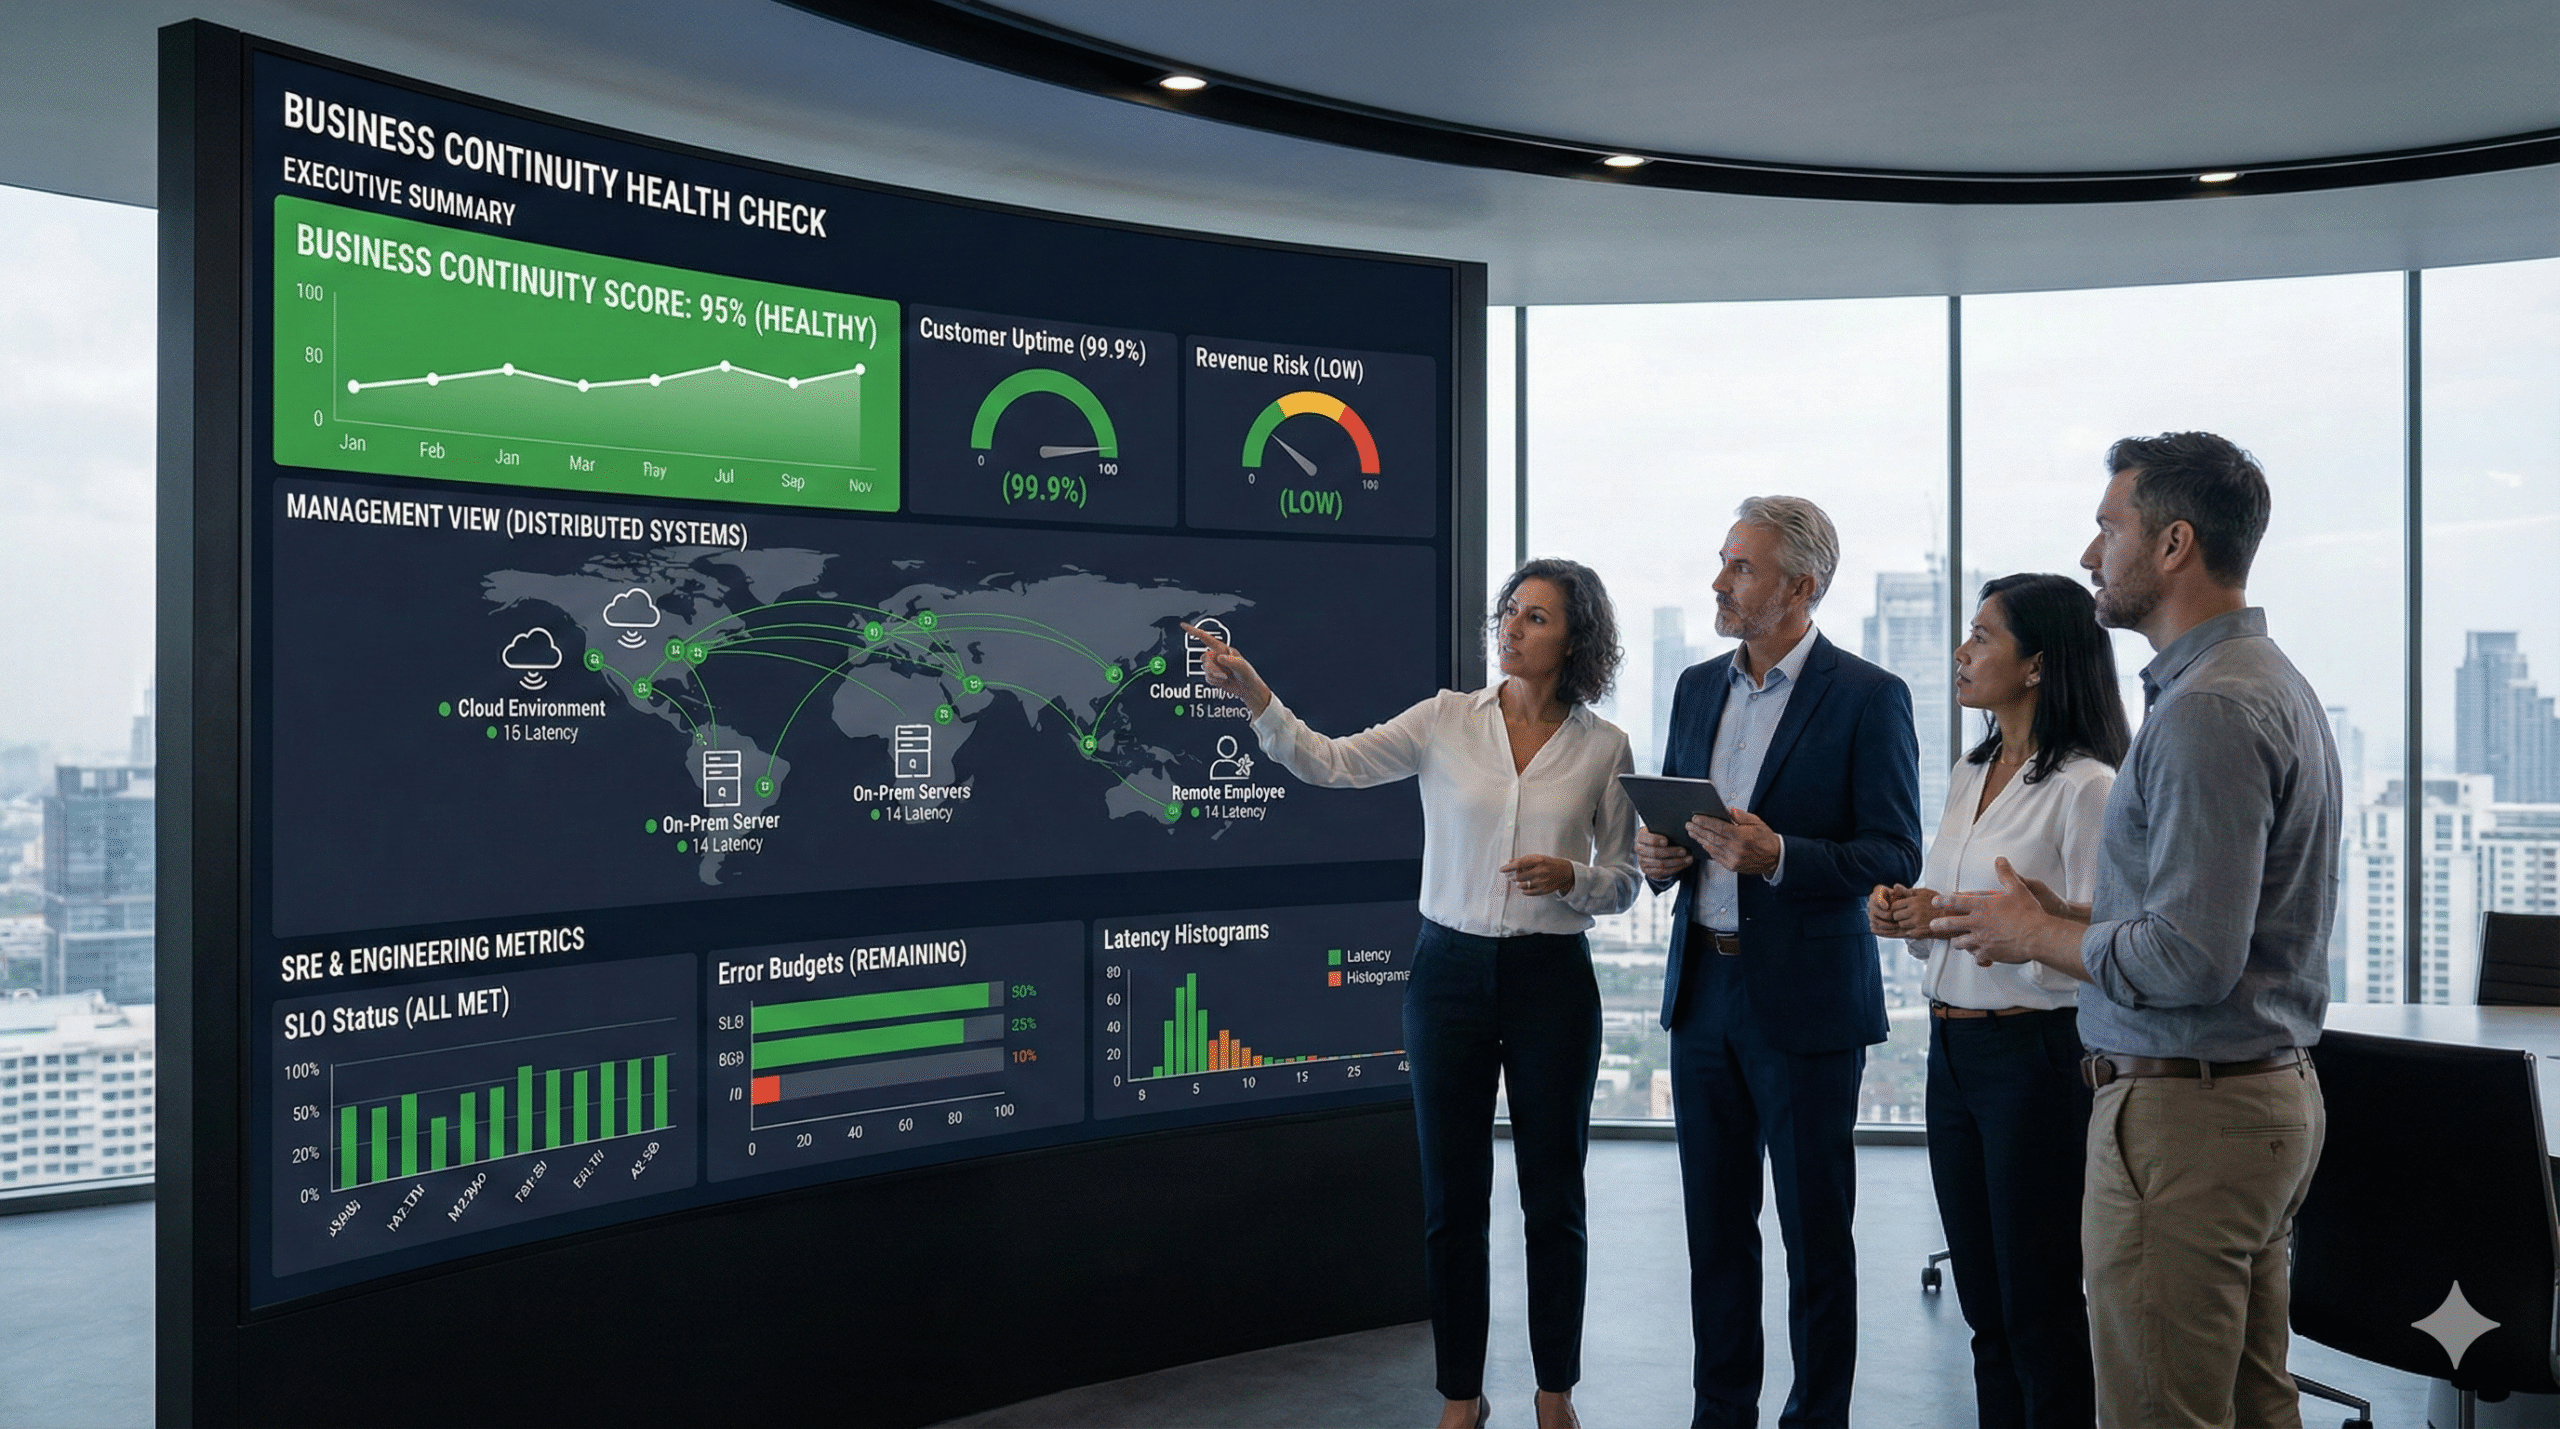
This isn’t a theoretical exercise. This is a practical framework for Remote Infrastructure Monitoring (RIM) that directly supports business continuity. It’s a unified health check that connects the dots between server latency and your ability to serve customers. In this guide, we’ll walk you through a complete, three-tiered approach that addresses everyone from the C-suite to the engineers on the ground floor.
Table of Contents
- The Business Case for Proactive Monitoring (The Executive View)
- Decoding Network Health: The SRE Golden Signals in Practice
- The Hybrid Challenge: Monitoring Your Cloud and On-Prem Connections
- The 6-Point Quarterly Health Check Template (The Operational View)
- Packaging the Findings: The Executive Summary Blueprint
- Frequently Asked Questions
- From Reactive Alerts to Proactive Resilience
The Business Case for Proactive Monitoring (The Executive View)
Let’s be honest. When you talk about investing in “monitoring,” a lot of executives hear “cost center.” They want to see a clear return on investment, a hard number that justifies the expense. And that’s where most IT leaders get stuck. They try to justify monitoring with technical jargon, but the conversation falls flat.
Here’s a better way to frame it: Remote Infrastructure Monitoring isn’t an expense; it’s an insurance policy against downtime.
Think about it this way. You don’t buy fire insurance hoping your building burns down so you can cash in. You buy it to mitigate a catastrophic financial risk. The same logic applies here. According to BCMMetrics, trying to calculate a direct ROI on business continuity is flawed. The real value isn’t in what you earn, but in what you don’t lose.
Every minute of downtime has a quantifiable cost—lost revenue, decreased productivity, reputational damage, and potential SLA penalties. Proactive monitoring is the system that alerts you to the smoke before the fire starts. It’s the difference between a minor 5-minute performance tweak and a 5-hour outage that makes headlines for all the wrong reasons.
And this isn’t a niche concern. The global market for Remote Infrastructure Management is growing at a staggering rate, with some regions seeing a CAGR of over 13%. Businesses are waking up to the reality that in a distributed world, you simply can’t manage what you can’t see. Investing in a robust monitoring framework is no longer a luxury; it’s a fundamental requirement for modern business resilience. It’s a strategic decision to ensure the technology that runs your business… actually keeps running.
Decoding Network Health: The SRE Golden Signals in Practice
So, how do you actually measure the health of a complex, distributed system? For years, engineers relied on a flood of alerts from individual components. CPU at 90%! Disk space low! The result? Alert fatigue. IT teams become so inundated with noise that they miss the signals that truly matter.
This is the problem Google’s Site Reliability Engineering (SRE) teams set out to solve. Instead of monitoring a thousand different causes, they decided to focus on four universal symptoms of poor health. They called them The Four Golden Signals. If you monitor these four things for every major service, you will almost always know when a problem is brewing, long before it impacts your users.
Let’s break them down.
- Latency: The time it takes to service a request. Think of it as the delay between a user clicking “buy now” and the page confirming their order. High latency is a classic precursor to an outage. It’s the system struggling to keep up. You should be tracking not just the average latency, but the “long tail”—the 99th percentile—because that’s where your most frustrated users are.
- Traffic: A measure of how much demand is being placed on your system. This could be measured in requests per second for a web server or megabits per second for a network link. A sudden spike or dip in traffic is a massive red flag. A spike might mean a denial-of-service attack, while a sudden drop could signal that an entire segment of your network has gone offline.
- Errors: The rate of requests that fail. This can be explicit failures (like a 500 server error) or implicit ones (like a request that returns the wrong content). Tracking the error rate is non-negotiable. If it starts climbing, you know something is broken and needs immediate attention.
- Saturation: How “full” your service is. Saturation is a measure of your system’s capacity and how close it is to its limit. Think of it as the occupancy rate of a hotel. A consistently high saturation rate (e.g., CPU utilization constantly above 80%) means you have no headroom. The next small traffic spike could be the one that brings the whole system down.
By focusing on these four signals, you move from a chaotic, reactive mode to a proactive, data-driven one. You’re no longer just asking “Is the server on?” You’re asking, “Is the server healthy and performing well for our users?” It’s a profound shift that forms the technical bedrock of any serious business continuity plan.
The Hybrid Challenge: Monitoring Your Cloud and On-Prem Connections
The Four Golden Signals are a fantastic framework, but applying them in a hybrid world adds a critical layer of complexity. Remember that stat? Over 90% of businesses are running workloads both on-premises and in the cloud. The most fragile—and often most overlooked—part of this setup is the connection between them.
Your private VPN, your AWS Direct Connect, your Azure ExpressRoute… this link is the digital supply chain for your entire operation. If it becomes slow or unreliable, everything grinds to a halt. Your on-prem accounting software can’t sync with your cloud CRM. Your factory floor can’t get data from your cloud-based inventory system.
Monitoring this hybrid link requires more than just a simple ping test. To truly understand its health, you need to establish deep technical expertise. As experts at Datadog and AWS point out, best practices involve a multi-pronged approach:
- Synthetic Probes: These are automated tests that constantly simulate user traffic between your on-prem data center and your cloud environment. They measure things like per-hop latency, telling you exactly which router or switch in the path is causing a slowdown.
- Flow and Packet Telemetry: Tools like NetFlow and IPFIX capture metadata about the traffic crossing the link. This allows you to see not just that there’s a lot of traffic, but what that traffic is. Is it a legitimate data backup, or a rogue application flooding the network?
- Path Change Detection: The route your data takes across the internet or your private link can change without warning. Monitoring for these path changes is crucial because a new, less optimal route can introduce significant latency and packet loss.
Managing this requires a sophisticated set of tools and skills. It’s one of the primary reasons businesses turn to managed IT services. They need a partner who lives and breathes this complexity and can build a monitoring blueprint that sees the whole picture. Without this deep visibility into the hybrid connection, you’re flying blind at the most critical junction of your entire IT infrastructure. An effective partner can also help manage your entire set of cloud solutions to ensure seamless integration and performance.
The 6-Point Quarterly Health Check Template (The Operational View)
So we have the executive buy-in and the technical philosophy. Now, how do we make it real? How do we turn this into a repeatable process that ensures nothing slips through the cracks?
This is where the operational implementer—the IT manager or MSP technician—needs a concrete plan. Forget abstract ideas; they need a checklist. Based on best practices from across the industry, here is a 6-Point Quarterly Health Check that unifies everything we’ve discussed.
1. Infrastructure & Asset Inventory
You can’t protect what you don’t know you have. This step involves a full discovery and inventory of all hardware, software, cloud subscriptions, and user accounts. Is everything documented? Are there any “shadow IT” applications running that you don’t know about?
2. Performance & Saturation Analysis (The Golden Signals)
This is the core technical audit.
- Latency: Review 90th and 99th percentile latency for all critical applications and hybrid links. Are there any upward trends?
- Traffic: Analyze traffic patterns. Are there unexplained spikes or dips? Is bandwidth utilization approaching saturation?
- Errors: Audit application and system logs for error rates. Are specific services throwing more errors than last quarter?
- Saturation: Check CPU, RAM, and disk utilization on key servers and cloud instances. Are any systems consistently running “hot” with no headroom?
3. Security & Patch Management
A healthy network is a secure network. This involves verifying that all systems are patched with the latest security updates, running vulnerability scans, and reviewing access control lists. Strong cybersecurity and compliance practices are a non-negotiable part of system health.
4. Backup Validation & Recovery Testing
A backup that hasn’t been tested is just a prayer. This step is critical. Don’t just check if the backup job completed. Perform a test restore of a critical file, or better yet, a full virtual machine. Can you meet your Recovery Time Objective (RTO) and Recovery Point Objective (RPO)? Reliable data backup and recovery is essential to business continuity.
5. Incident Response Readiness
When an incident occurs, do you have a clear plan? Review your incident response plan. Are contact lists up to date? Does everyone on the team know their role? Run a tabletop exercise to simulate a disaster scenario, like a ransomware attack or a primary data center failure.
6. Business Continuity Management (BCM) Alignment
This is the step that ties it all together. Review the findings from the first five points with business stakeholders. Does the current state of IT infrastructure support the company’s stated continuity goals? If the business requires a 15-minute RTO for its ERP system, but your recovery tests show it takes 4 hours, you have a critical misalignment that needs to be addressed.
Packaging the Findings: The Executive Summary Blueprint
You’ve done the work. You’ve run the health check. You have pages of technical data, logs, and performance graphs. Now for the most important part: translating it all into a language the executive team understands and can act on.
Your report should not be a data dump. It should be a strategic document that tells a story. Here’s a blueprint for an executive summary that works:
1. Overall Health Scorecard
Start with a simple, color-coded summary. Grade each of the six areas from the health check (Inventory, Performance, Security, etc.) as Green (Healthy), Yellow (Needs Attention), or Red (Critical Risk). This gives executives an immediate, at-a-glance understanding of the current state.
2. Key Findings & Business Impact
In plain English, summarize the most important discoveries. Don’t say, “99th percentile p99 latency on the SQL server increased by 50ms.” Say, “Our core financial application is slowing down, leading to a 10% increase in customer support tickets and putting our end-of-quarter reporting at risk.” Always connect the technical finding to a direct business impact.
3. Prioritized Action Plan
This is your recommendation. List the top 3-5 actions that need to be taken, who is responsible, and the expected outcome. Frame them as investments to mitigate specific risks. For example:
- Action: Upgrade the firewall connecting to our cloud provider.
- Risk Mitigated: Reduces the risk of a network bottleneck that could cause a 4-hour sales outage, estimated to cost $250,000 in lost revenue.
- Required Investment: $15,000.
4. Strategic Outlook
Briefly discuss how these actions align with the broader business goals. Are you preparing for a new product launch? Expanding into a new region? Connect your infrastructure recommendations to the company’s future success.
By packaging your findings this way, you elevate the conversation from technical minutiae to strategic risk management. You empower leadership to make informed decisions based on clear, business-focused data.
Frequently Asked Questions
Q1: What is Remote Infrastructure Monitoring (RIM)?
RIM is the process of monitoring and managing IT infrastructure (servers, networks, applications) from a remote location. In today’s world of hybrid work and cloud computing, it’s essential for maintaining visibility and control over a decentralized network, ensuring business continuity regardless of where your assets are located.
Q2: Isn’t our cloud provider (AWS, Azure, Google) responsible for monitoring?
Cloud providers are responsible for the health of their underlying infrastructure (the “cloud”). However, you are responsible for the health and performance of everything you run in the cloud—your virtual machines, applications, and data. You are also solely responsible for the connection between your on-premise network and the cloud. This is known as the Shared Responsibility Model.
Q3: How is this different from basic alerting?
Basic alerting is reactive. It tells you when something has already broken (e.g., “Server is down”). The framework we’ve discussed is proactive. By monitoring leading indicators like latency and saturation (the Golden Signals), you can identify and fix problems before they cause an outage, which is the entire goal of a business continuity strategy.
Q4: We’re a small business. Isn’t this kind of monitoring overkill?
Not at all. The principles scale to any size. The core idea is the same whether you have 10 servers or 10,000: you need to understand the health of the systems your business relies on. The tools and frequency might change, but the need for visibility and a proactive approach is universal. In fact, for a small business, a single outage can be even more devastating, making this discipline even more critical.
From Reactive Alerts to Proactive Resilience
The days of setting up a simple “up/down” alert and calling it a day are long gone. The modern IT landscape is too complex, too distributed, and too critical to business survival for such a simplistic approach.
Building a truly resilient organization requires a unified strategy—one that speaks the language of risk to the C-suite, embraces the gold-standard principles of SRE for the tech team, and provides a clear, actionable playbook for the operations managers who keep the lights on.
By integrating the executive view, the technical foundation, and the operational checklist, you transform remote infrastructure monitoring from a reactive chore into a strategic advantage. You build a system that doesn’t just tell you when things are broken; it gives you the foresight to keep them running, ensuring your business remains online, productive, and profitable.
Ready to build a monitoring framework that guarantees business continuity? Schedule a discovery call with DART Tech today. We’ll help you implement a tailored health check process that gives you complete visibility and control over your entire hybrid infrastructure.


